How do you measure the success of a school? The work of schools is so complex and is not done in isolation, with families playing such an important role. There is no clearly defined product. There are many metrics parents and students can use to judge the success of their school: friendships and networks formed, curiosities aroused, sense of belonging, identification of strengths and interests, opportunities to engage in diverse experiences and many, many more. Education certainly cannot be reduced to a number. To do so is a bit like equating health with a number. There are many dimensions to health and education. A single number does not tell all about a person’s health, but it can be a useful indicator. Core body temperature is a number used in that way. VCE scores fulfill a similar role in secondary schools. The offers to graduates from tertiary institutions are another more tangible assessment – after all there are indicators of poor health that do not require anything as abstract as a temperature or ATAR!
What do Strathcona’s VCE results and tertiary offers indicate about the state of the School’s academic health? They are consistent with a school that is fighting fit academically.
Firstly, the VCE. The scores come in two forms: the Study Score and the ATAR. Each student receives a Study Score for each subject (Study) taken at Unit 3 & 4, the level usually undertaken at Year 12. The Study Score is a number between 0 and 50. It is not a mark, like a percentage, but the product of some statistical wizardry.
Most people are familiar with the concept of a statistical average, or mean. The mean can be understood as what each student would receive if all scores were added up then shared equally among the students. The statisticians set the state mean Study Score as 30 for all VCE studies. So if the average mark in Physical Education is 72% (including moderated internal assessment and examination results), a student achieving 72% will get a Study Score of 30. All of the marks for each subject are then sorted to fit what is known as a normal distribution or bell curve with a standard deviation of 7. Put simply, that means 30 is the most common score (the mode), 29 and 31 the next most common, 28 and 32 the next and so on. Most Study Scores in the state are between 23 and 37. Below 23 and above 37 the numbers of students achieving scores declines dramatically. Only 9% achieve above 40 and 2% achieve 44 or more.
So how does Strathcona rate as a school in terms of Study Scores? The Study Scores of schools are typically expressed in terms of the median. This is the middle score. Half of the Study Scores in the school are by definition above the median. The median is not changed by a few exceptional performances or a few low performances, as the mean might be. The median Study Score at Strathcona in 2019 was 36 (the mean and mode were also 36). It has been 36 in eight of the last twelve years, 35 three times and 37 once. In 2018, if two of the thirty-five Study Scores of 35 were 36, we would have achieved a 36 then also.
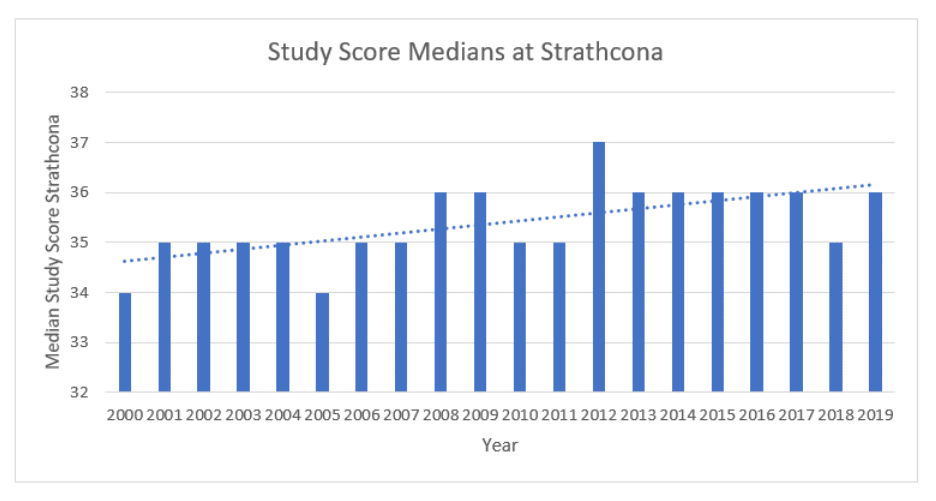
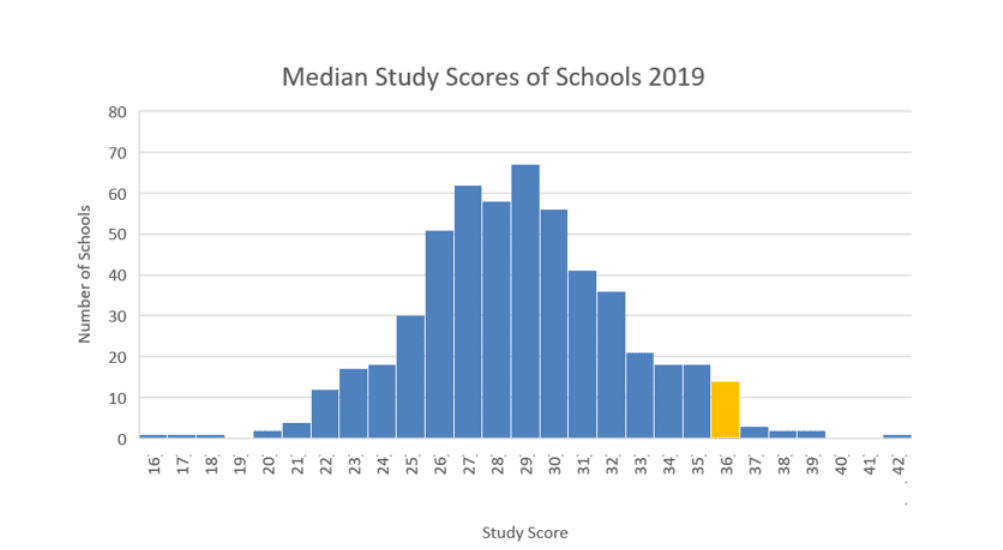
So is this good? The median shows us what is normal at Strathcona. The median Study Score for the average school in Victoria is 29! Strathcona is equal ninth along with 13 other schools scoring 36. This is out of 535 schools. Strathcona’s performance is outstanding.
This can be depicted graphically as below, with schools achieving a median of 36 coloured in yellow. The school with a median of 42 had only one student. Strathcona had 538 Study Scores. The median Study Score has proved to be a robust measure reflecting the ongoing culture of the school. Many teachers and all students have changed over that time but the median has remained very stable.
For many years, on this measure Strathcona has been one of the highest performing schools in the state. A consequence of this is that the students are in high performing classes. They might feel they are not performing well in a subject simply because they are below average in the class. They might still be above average in the state.
In the same way that being average in one school is not the same as being average in another due to the different cultures and cohorts, being average in one subject is not the same as being average in another. Before the Study Scores can be used to form the ATAR, more statistical wizardry is performed called scaling. Some subjects are scaled up and others down, usually by small amounts based on the performance of the students in their other subjects. If they performed above the average student, the cohort is strong, it is harder to achieve the same study scores as in other subjects so the scores are scaled up. In considering Strathcona’s performance in Study Score medians, it is important to remember another success of Strathcona, the very strong proportion of students in subjects that are scaled up compared with students in other schools, in particular, girls schools: subjects like Chemistry, Physics, Specialist Mathematics and Mathematical Methods. Strathcona girls are taking on the challenge.
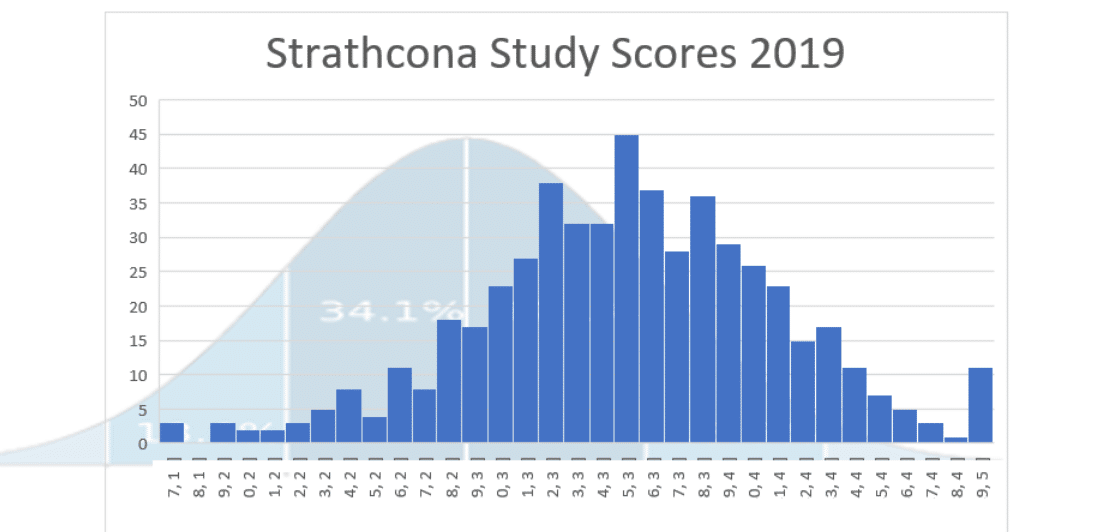
Graphing the Study Scores achieved by Strathcona compared with the state distribution shows how the distribution is similar in shape but the corresponding scores are all higher. We also see the amazing number of 50s – 11, which is in the top ten schools, not taking into account that it is smaller than any of the schools above it in the list.
The second measure in the VCE is the ATAR, at tool used for tertiary entrance. This takes the Year 12s and compares their performance against every other student in their Year 7 cohort (including those who did not do VCE). The combined scores from their scaled Unit 3/4 Studies are put in rank order. The top 0.05 % of students are given the top ATAR (99.95), the next 0.05% are given the next ATAR of 99.90 and so on.
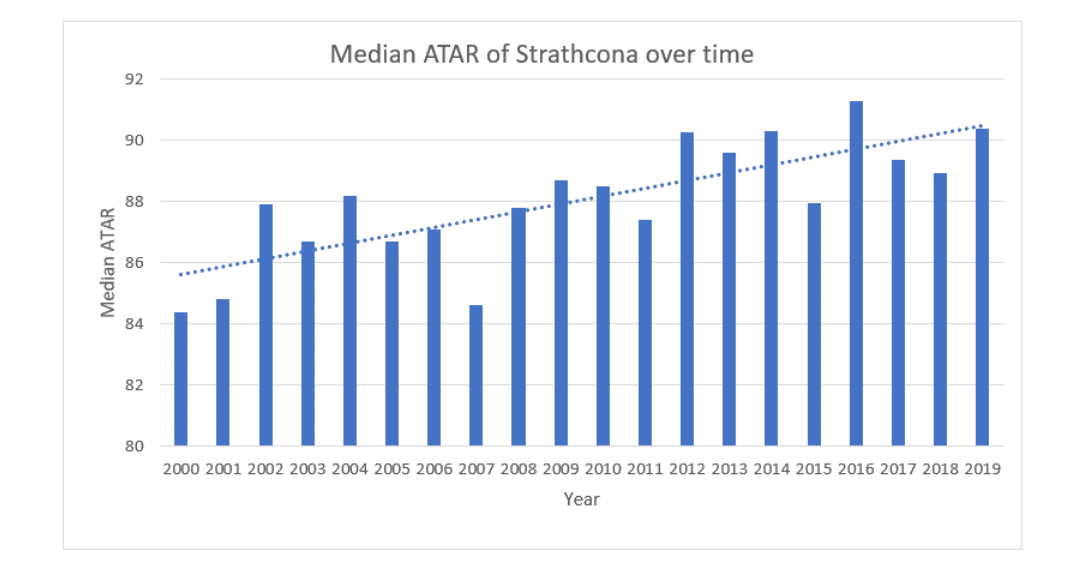
The following graph shows Strathcona’s performance on this measure since it was introduced. Around half of our students are achieving an ATAR of 90 or above. In other words 50% of Strathcona students are performing better than 90% of their Year 7 state cohort. Again, this is a reflection of the academic culture of the school.
ATARs are interesting, but their purpose is to help tertiary education institutions select students into their courses. Strathcona students have great success accessing a huge range of courses, in diverse institutions in Victoria, Interstate and Internationally.
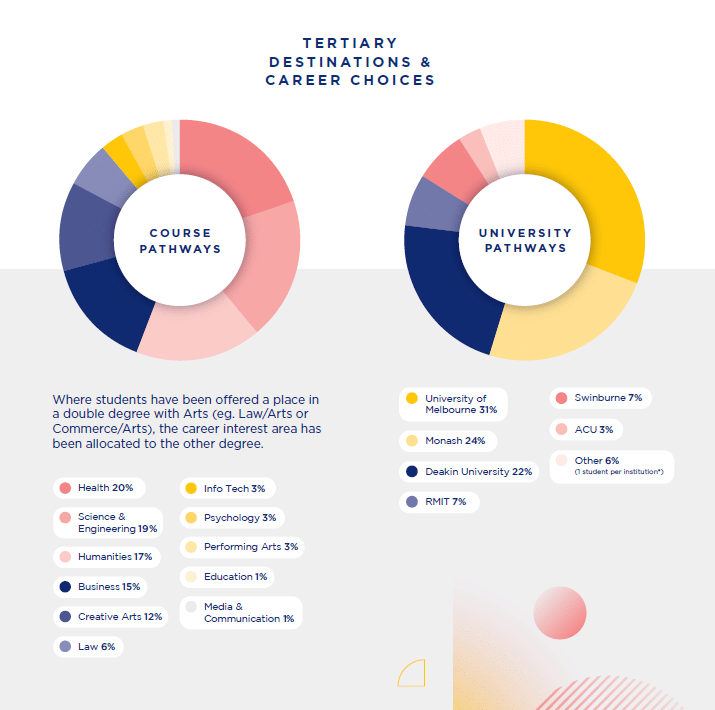
All Strathcona students in 2019 were offered places in tertiary institutions, usually their first or second preference. The Victorian Institutions are summarised in the following pie chart.
What they have been offered to enrol in at those Institutions is diverse and can be classified as in the below pie chart.
We are aware of two students applying to universities in the US and the UK, two to the ANU in Canberra, one to the University of Adelaide, three to TAFEs and two taking gap years.
We celebrate the wonderful achievements of the girls of 2019 and wish them all the best for the next phase of their journeys.


